Quality Journey, Quality Center, and Dashboards
Quality Hub provides three main ways of gathering insights from your testing activities:
- Quality Journey
- Quality Center
- Packaged reports and dashboards
Because all the information is stored in Salesforce, your team can further leverage the Salesforce platform to create standard reports and dashboards or use BI and analytics tools to produce more profound insights.
Quality Journey
The Quality Journey page is the landing page on the Test Management app, as its main purpose is to help users continue with their work or highlight the latest test executions they may need to pay attention to.
This page has six main components:
- Quick Create button helps you quickly create a test case, raise a defect, or create a test project or a test plan.
- Your First Steps nudges you to complete some of the most important activities you can perform in Provar Manager.
- Recently Viewed Items can help you return to a record you were viewing recently.
- Test Cases to Work On shows your test cases in Draft, Design, or Pending Implementation stages.
- Failing Test Cases You Own highlights recent executions where a test case you own failed.
- Latest Test Cycles allow you to check what tests have been executed lately.
Quality Center
Quality Center is a dashboard tailored to QA managers who want to learn more about the test executions, defects, test coverage, code quality, and test management metrics gathered from all the activities logged into Quality Hub.
You can access the Quality Center from the Test Management application.
It offers three different views of the data:
- Environments view lets you drill down into particular environments and systems.
- Test Projects view lets you drill down into particular test projects and test plans.
- Test Case Management view offers a view into how your teams manage their tests.
Note: it may take a few seconds to load the first time.
Dashboards
Test Cases Dashboard
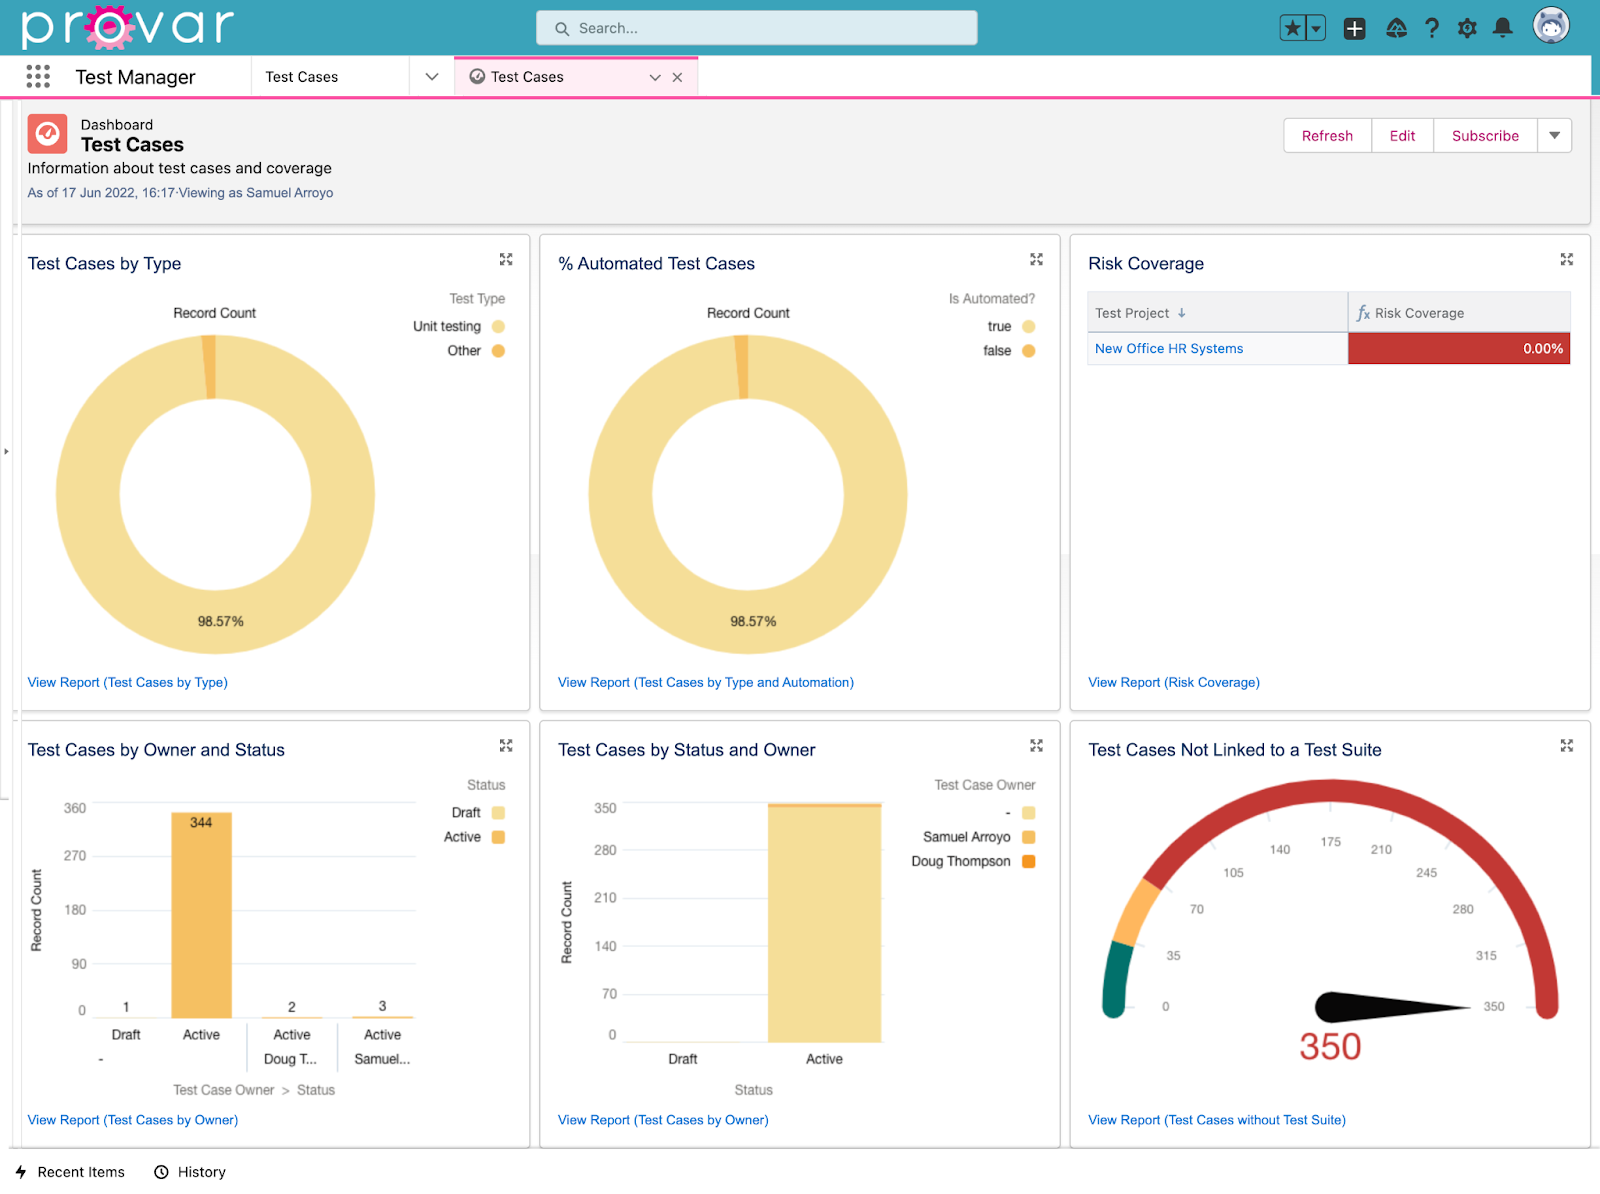
Above: Snapshot of the Test Cases dashboard.
The Test Cases dashboard shows information about your test cases, risks, and test owners.
- Test Cases by Type is helpful to understand how your test cases are distributed by type, which can trigger questions like Do we have enough % of security tests? or What should our % target be for functional tests?
- % of Automated Test Cases can be helpful if you aim to increase the number of automated tests, e.g., We want to automate 40% of our test cases by the end of Q2.
- Risk Coverage shows you how many risks identified in each test plan have test cases against them, which can trigger questions like Why is the Risk Coverage below 50% on this test plan? or How can we test that we are mitigating more risks on this test plan?
- Test Cases by Owner and Status shows you the test case ownership distribution, which can trigger questions like Why do we have so many test cases without an owner? or How can we better distribute test cases amongst the team?
- Test Cases by Status and Owner shows you how test cases are progressing through the pipeline and who is working on what test cases.
- Test Cases Not Linked to a Test Suite can help you consider questions like A big % of our test cases are not organized in test suites. How can we fix that?
Test Executions and Defects Dashboard
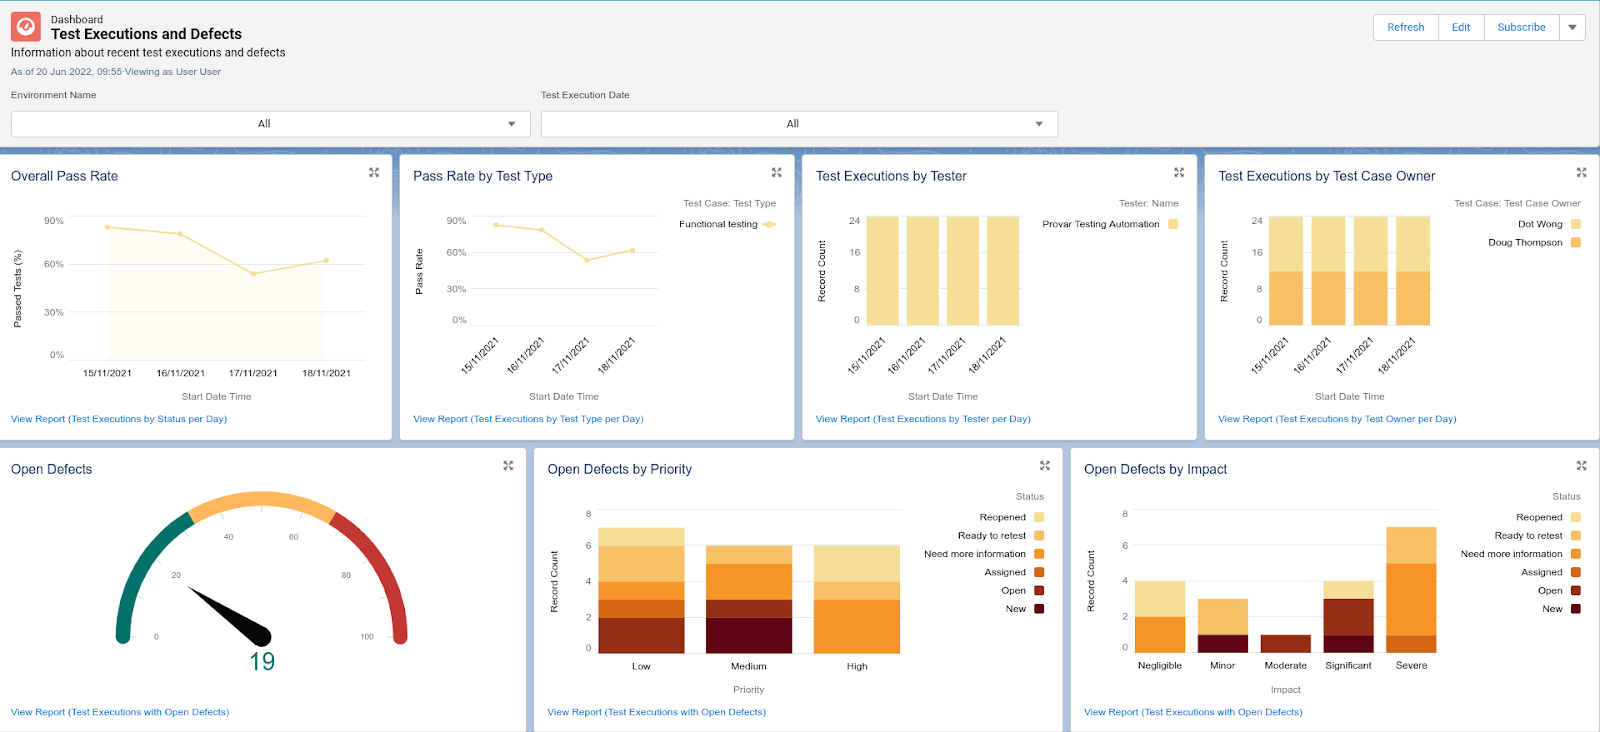
Above: Snapshot of the Test Executions and Defects dashboard.
The Test Executions and Defects dashboard shows information about the latest test executions and open defects and can be filtered by Environment and Test Execution Date.
- Overall Pass Rate shows the percentage of test executions that passed each day, providing a high-level overview of the status of QA executions across the projects.
- Pass Rate by Test Type can help you understand what tests uncover the most quality issues and where your team could focus their energies.
- Test Executions by Tester is helpful to get an overview of how the daily test executions are distributed across your team.
- Test Executions by Test Case Owner shows you who owns the tests being executed, which can help you distribute test case ownership more efficiently amongst the team.
- Open Defects can be used to see if the number of open defects is between the set thresholds.
- Open Defects by Priority provides information that can help you understand how the most important defects are being fixed.
Open Defects by Impact shows you the distribution of open defects depending on their impact on the business.