Quality Hub Test Coverage
Test coverage helps monitor the quality of testing, and assists testers to create tests that cover areas that are missing or not validated.
User Story Coverage

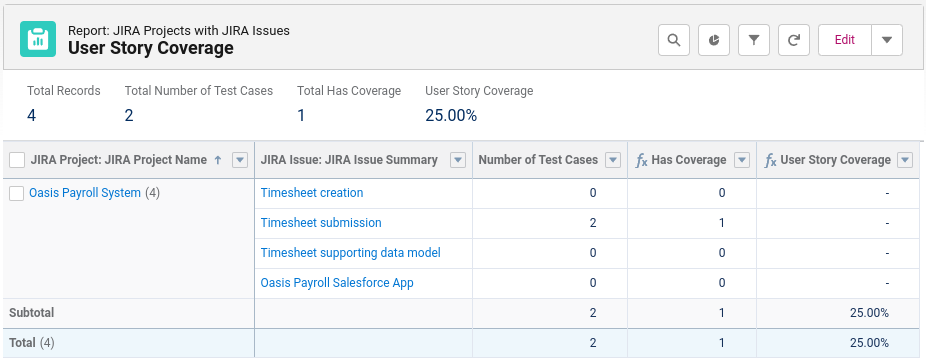
Above: Snapshot of the User Story Coverage report.
The User Story Coverage report lists all Jira Issues and whether or not they have test cases associated. This report can help you identify which user stories are missing test cases that validate their acceptance criteria.
Requirements Traceability Matrix

Above: Snapshot of the Requirements Traceability Matrix report.
The Requirements Traceability Matrix report lists all the Jira Issues and the test cases associated with them.
Risk Coverage

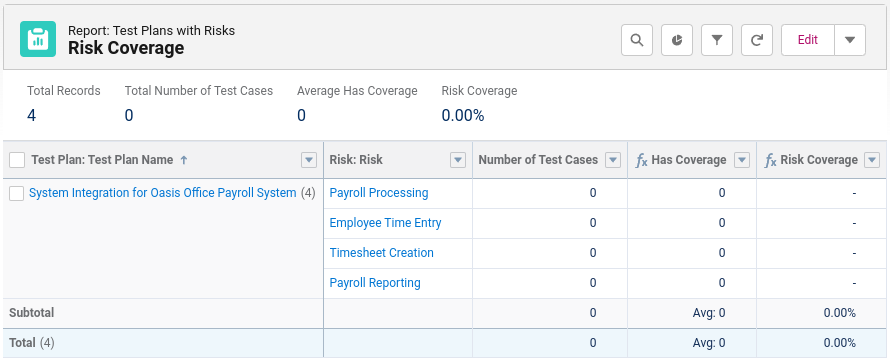
Above: Snapshot of the Risk Coverage report.
The Risk Coverage report lists all the identified risks on each test plan and whether there are test cases associated with each risk. This report can help identify those risks missing test cases that make sure the mitigation plan is working as expected.
Risk Coverage Matrix

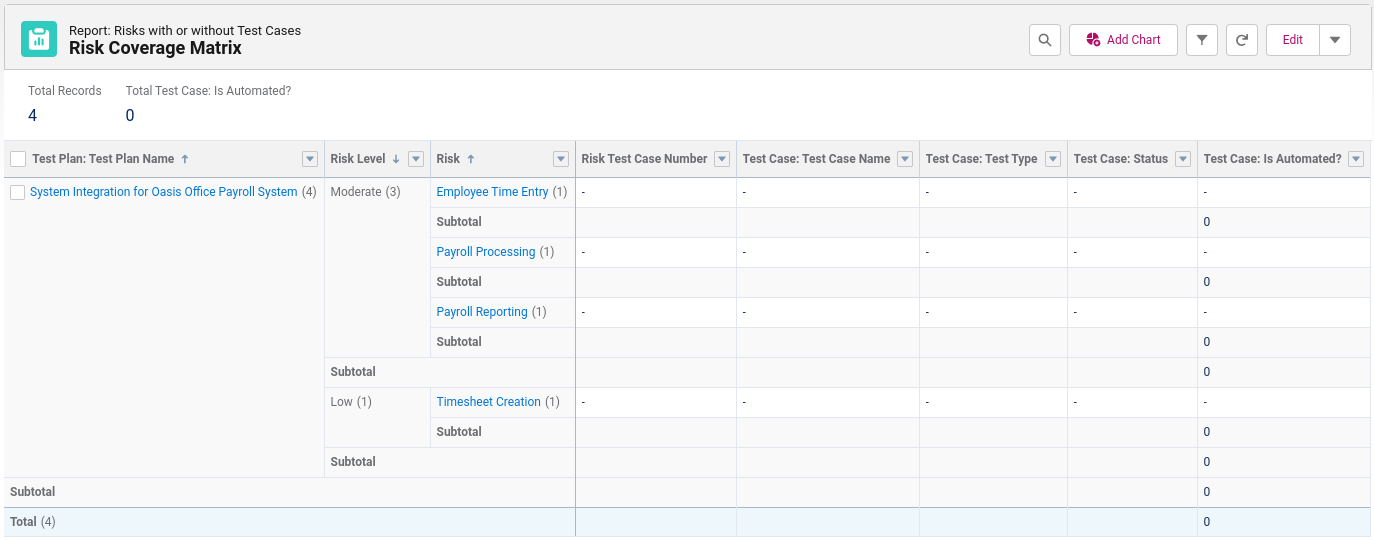
Above: Snapshot of the Risk Coverage Matrix report.
The Risk Coverage Matrix report shows all the test plan risks and the test cases associated with each.
Metadata Coverage

Above: Snapshot of a Coverage Report record.
Each Coverage Report record shows the number of components reported, and the individual coverage of each component.
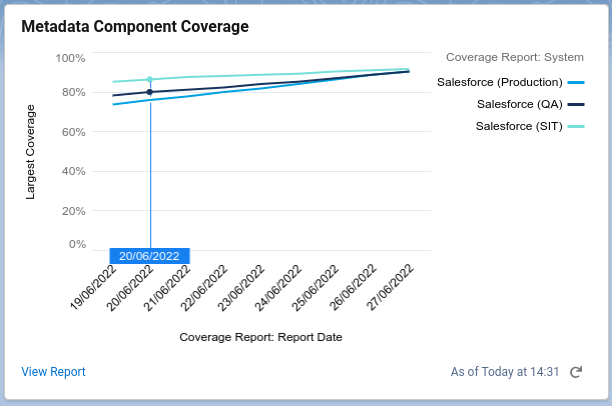
By clicking on an individual component, you can see its coverage evolution over time and the test cases related to that component.
Teams can easily see if there were drops in coverage at a particular point in time, or if the coverage % is lower than the permitted threshold.

Above: Snapshot of a Metadata Component Coverage chart.
- Home
- How to Use Quality Hub
- AI in Quality Hub
- Actionable Insights
- Quality Hub Setup
- Quality Hub Setup and User Guide
- Installing/Updating Quality Hub
- Configuring Quality Hub
- Setting Up a Connection to Quality Hub
- How to Know if a File in Automation is Linked in Quality Hub
- Uploading Existing Manual Test Cases to Quality Hub with DataLoader.io
- Object Mapping Between Provar Automation and Quality Hub
- Quality Hub Filters
- Metadata Coverage with Quality Hub
- Quality Hub Integrations
- Plugins
- Release Management
- Test Management
- Test Operations
- Release Notes