Quality Hub Dashboard Configuration
Quality Hub Configuration
This tab is accessible from the Provar Quality Hub or Provar Quality Hub Setup apps.
Configuring the Cost Model, KPIs & Thresholds and Metrics Processing is a key aspect of setting up the Quality Hub Dashboard for org-specific insights.
Cost Model Configuration
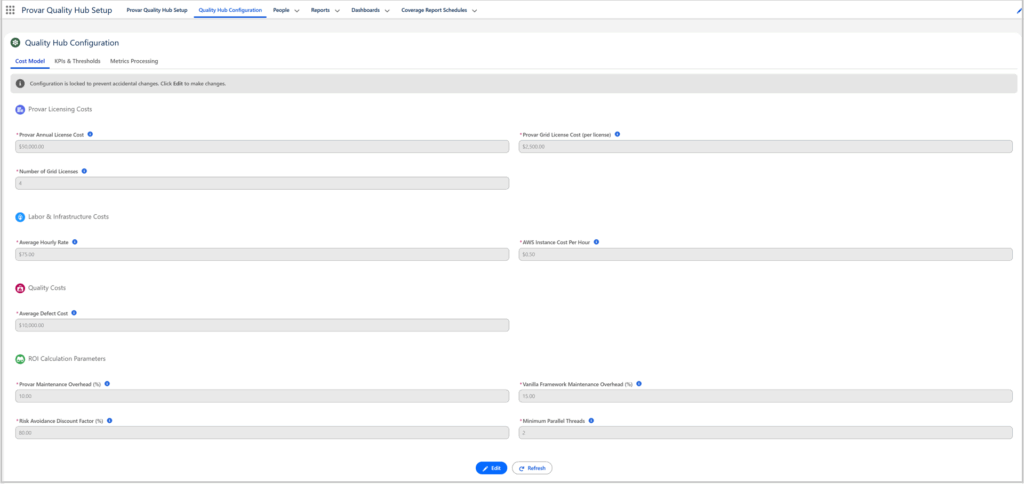
The Cost Model tab allows users to configure their Provar Licensing Costs, Labor & Infrastructure costs (for ROI/savings), Quality Costs, and ROI Calculation Parameters.

Provar Licensing Costs
This section includes Provar Annual License Cost (not including Grid), Provar Grid License Cost (per license), and Number of Grid Licenses. If you are NOT using Provar Grid, you can set the # of licenses and the cost to 0 to ignore these in the metrics calculations.
Set the Provar Annual License Cost to the total cost for your Automation + Quality Hub packages.
These values are used in the Provar Grid ROI & Overall ROI Metrics.
Labor and Infrastructure Costs
These values are used in both ROI Metrics, as well as insights used in the Manual Hours Saved and Team Capacity Freed metrics. The Average Hourly Rate is an estimated market for QA resources. The AWS Instance Cost Per Hour is the estimated hourly cost for an AWS instance used to run test automation, and is used by the Provar Grid ROI metric.
Quality Costs
The Average Defect Cost is defaulted to an industry average of $10,000. This is the estimated cost to find and remediate a bug discovered in Production. This value is used by the Defect Escape Rate, Risk Avoidance, and Overall ROI metrics.
ROI Calculation Parameters
The Provar Maintenance Overhead is a rough average of the total percentage of a Provar user’s time spent maintaining existing test cases. The Vanilla Framework Maintenance Overhead is a rough average of the total percentage of time spent maintaining test scripts in a generic framework, such as Selenium or Playwright. These are both used by the Overall ROI metric.
The Risk Avoidance Factor is used to calculate the % of a risk’s overall dollar impact that factors into the Risk Avoidance metric.
Minimum Parallel Threads are the minimum number of threads your team needs to run your test automation in a CI/CD pipeline to complete within an acceptable time period. This is used by the Provar Grid ROI and Overall ROI metrics.
KPIs & Thresholds
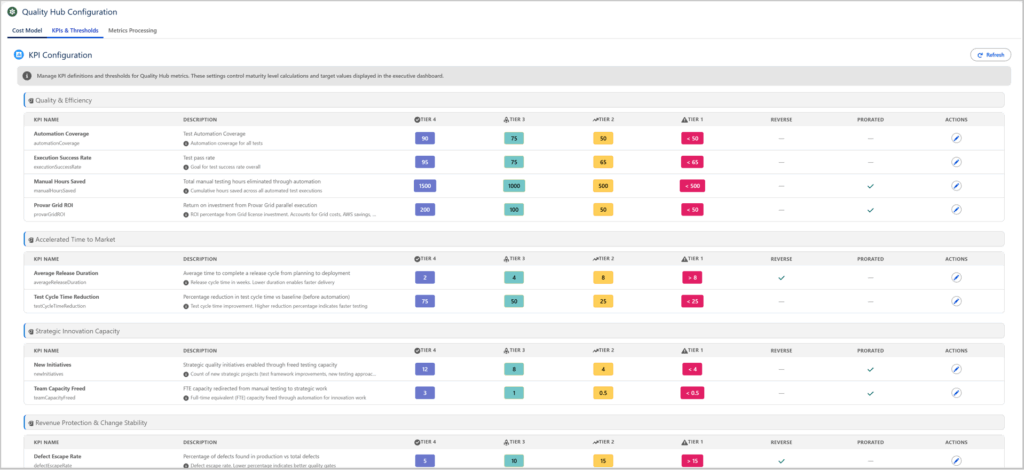
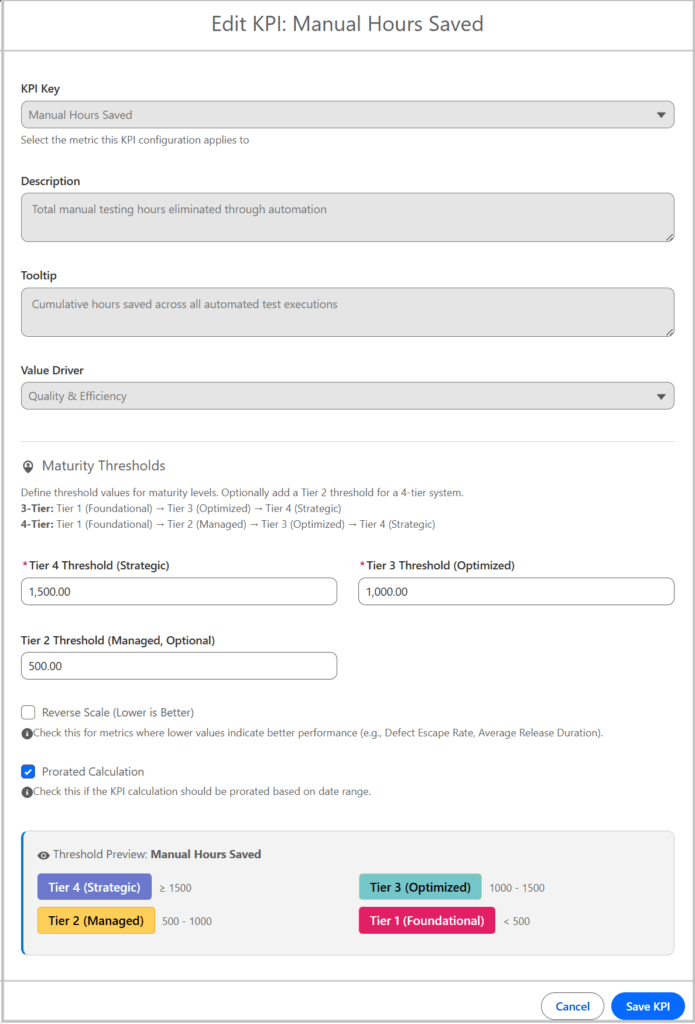
The KPIs & Thresholds tab allows the user to configure their KPIs for the Quality Hub Dashboard. Each KPI/metric has 4 configurable tiers, an optional prorate checkbox, and a reverse metric indicator (for reduction metrics).

In order to modify an existing KPI, simply click on the pencil icon in the relevant row, and you’ll be taken to the edit screen where you can edit the tier thresholds.

Each threshold for each metric already has the correct unit(s) attached to it with relevant defaults, so just follow the existing ones for examples and play with each to suit your requirements!
Metrics Processing
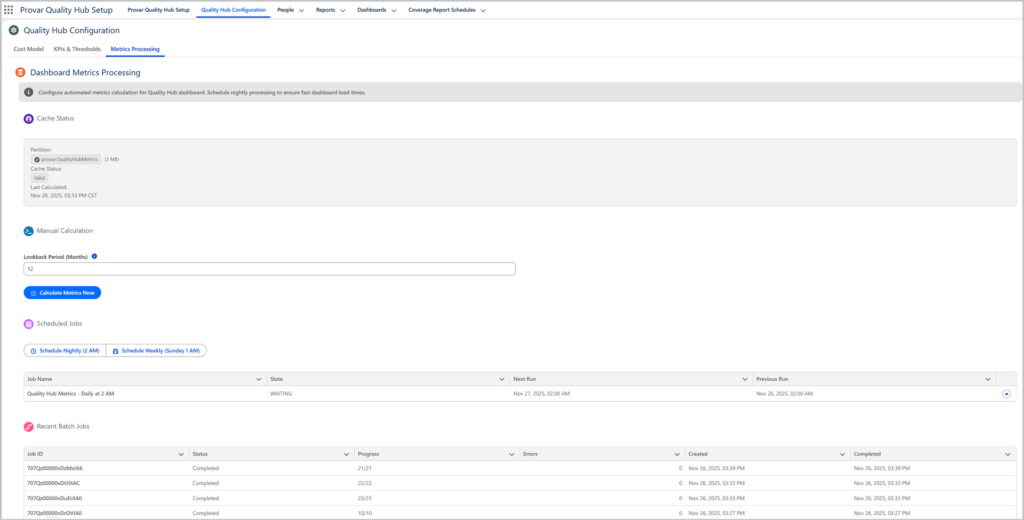
The Provar Quality Hub Dashboard page handles loading and presenting potentially 100k+ records at one time. Due to the heavy processing and governance limitations of Salesforce, there is a required back-end processing job that can be handled in this tab.

- Cache Status: The platform cache partition name (searchable in Setup > Platform Cache), status (stale/empty or valid), and latest timestamp. The Platform Cache is org-wide and will apply to all of your users. Provar Quality Hub comes with 3 MB of managed package cache by default and will not impact the existing org’s cache capacity.
- Manual Calculation: The option to manually process all Quality Hub Dashboard metrics for a given period of time, i.e. 12 months back.
- Scheduled Jobs: For simplicity and convenience, the user can schedule nightly or weekly metrics processing jobs to happen on a recurring basis. The timings are based on your Org’s timezone settings.
- Recent Batch Jobs: The recent history of metrics processing batch jobs that have run, their status, ID, and creation/completion dates.
It is not required to manually calculate the Quality Hub Dashboard Metrics in this tab, however, if you’d like to schedule them to reduce page load times, you have that capability. Jobs are automatically run and metrics are processed whenever the Quality Hub Dashboard page is loaded.
- Home
- How to Use Quality Hub
- AI in Quality Hub
- Actionable Insights
- Quality Hub Setup
- Quality Hub Setup and User Guide
- Installing/Updating Quality Hub
- Configuring Quality Hub
- Setting Up a Connection to Quality Hub
- How to Know if a File in Automation is Linked in Quality Hub
- Uploading Existing Manual Test Cases to Quality Hub with DataLoader.io
- Object Mapping Between Provar Automation and Quality Hub
- Quality Hub Filters
- Metadata Coverage with Quality Hub
- Quality Hub Integrations
- Plugins
- Release Management
- Test Management
- Test Operations
- Release Notes